Drones for golf courses: how to scout turf stress from the air


Quick Summary
Drones help golf course teams find turf stress that is hard to see from the ground, so crews go to the right areas first. This post covers what a drone flight can and cannot show, how often to fly, how to check what you find on the ground and how DroneDeploy turns your flights into a course map with plant health and thermal layers.
You manage a whole course with a small crew, and a dry spot or a stressed fairway is easy to miss until the turf shows it. In 2019 the USGA reported that maintenance staffs had shrunk over the previous decade, and that even the best turf managers can miss localized areas of stress. A drone flies the course faster than you can walk or drive it, and its images show variation that scouting from the ground can miss.
A drone will not tell you why an area is stressed. That part is still your call, which is why the routine around the flight matters as much as the aircraft. This post covers what a flight shows, how often to fly, how to check the results and how to turn the images into a map your crew can use. DroneDeploy Aerial handles the mapping step.
What can a drone show you about turf?
A drone shows you where turf looks different from the turf around it. It does not show you the cause. In 2019, USGA agronomist Brian Whitlark wrote that drones could not yet tell drought, compaction and disease apart, but that their imagery shows stress you may not see from the ground.
Three kinds of imagery do most of the work.
Color imagery. A standard camera gives you a color (RGB) index such as VARI, which maps how green the turf is across the course.
Multispectral imagery. A multispectral sensor captures near infrared light, which gives you indices such as NDVI that map plant vigor. In a 2015 Kansas State University study on creeping bentgrass test plots, the near infrared band and a green-blue index picked up differences between turf watered at 100% and 65% of estimated evapotranspiration. A handheld NDVI meter found no differences among plots from 100% down to 50%. USGA's summary of the study says high-resolution imagery from small drones can detect drought stress before it is visible to the human eye. It was early research on plots, not on a full course.
Thermal imagery. A thermal camera shows surface temperature. USGA says some courses capture aerial and thermal imagery on the same route, then use it to adjust irrigation scheduling.
How often should you fly, and who should review it?
USGA reports that some courses fly four to six days a week during the growing season. They fly the same route each time and meet with key maintenance staff after every flight to plan the work. Many superintendents bring in the assistant, the spray technician and the irrigation manager and go through the imagery hole by hole, which takes 15 to 20 minutes.
If that is more than your team can take on, start with one flight a week and add days as the routine proves its value. Flying the same route each time lets you compare dates and see what is getting worse.
The same imagery helps with decisions beyond the daily plan. Courses use it to refine irrigation scheduling, to prioritize aeration or sand topdressing and to show owners and green committees how shade affects the turf.
Check what you find on the ground
Drone images show you where to look. A short check on the ground shows you what is there. USGA recommends collecting soil moisture readings with a handheld meter in the areas the drone flagged. With repeated flights and readings, you learn to tell a wet area from a dry one and a diseased area from one stressed by traffic.
Keep a simple log with the date, the hole, what the drone showed and what you found. After a few weeks it becomes your own guide to reading the maps on your course.
Turn your flights into a course map with DroneDeploy
Here is how a flight becomes something your crew can act on.
- Fly the course. Plan a mapping flight in the DroneDeploy flight app. Live Map builds an approximate map on your device during the flight, so you can check coverage before you land.
- Process the images. DroneDeploy turns the images into a map you can zoom and measure. It processes multispectral imagery from the DJI Mavic 3 Multispectral, the DJI Phantom 4 Multispectral and MicaSense sensors. It also processes thermal imagery from thermal drones.
- Read the plant health layer. Plant Health shows a color index such as VARI or a multispectral index such as NDVI, and you can adjust the thresholds to highlight the turf that is struggling.
- Mark and measure. Drop markers on problem areas, measure how big they are and share the map with the people who will treat them.
- Check the ground shape. Elevation layers and contour lines show slope across a green, a fairway or a drainage path.
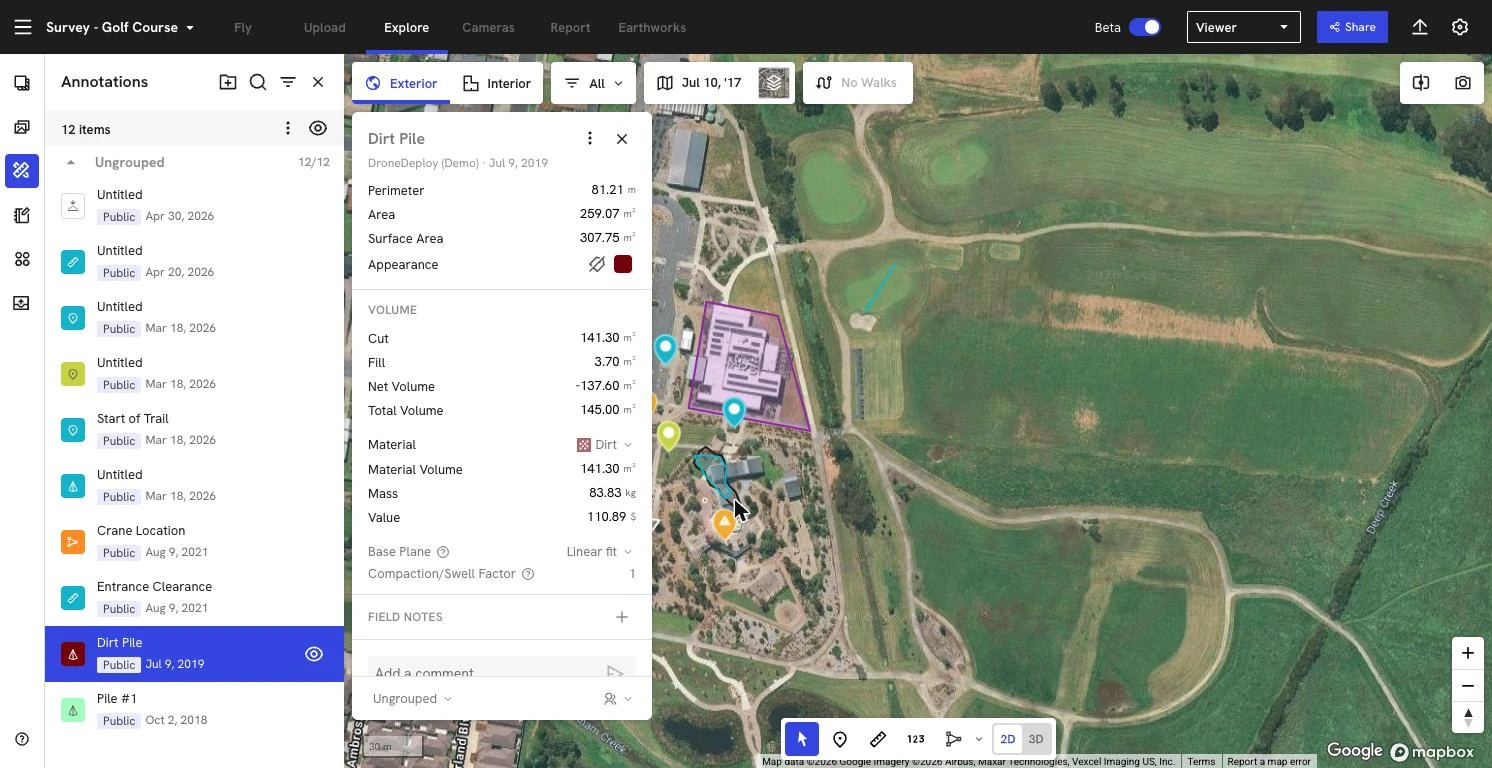
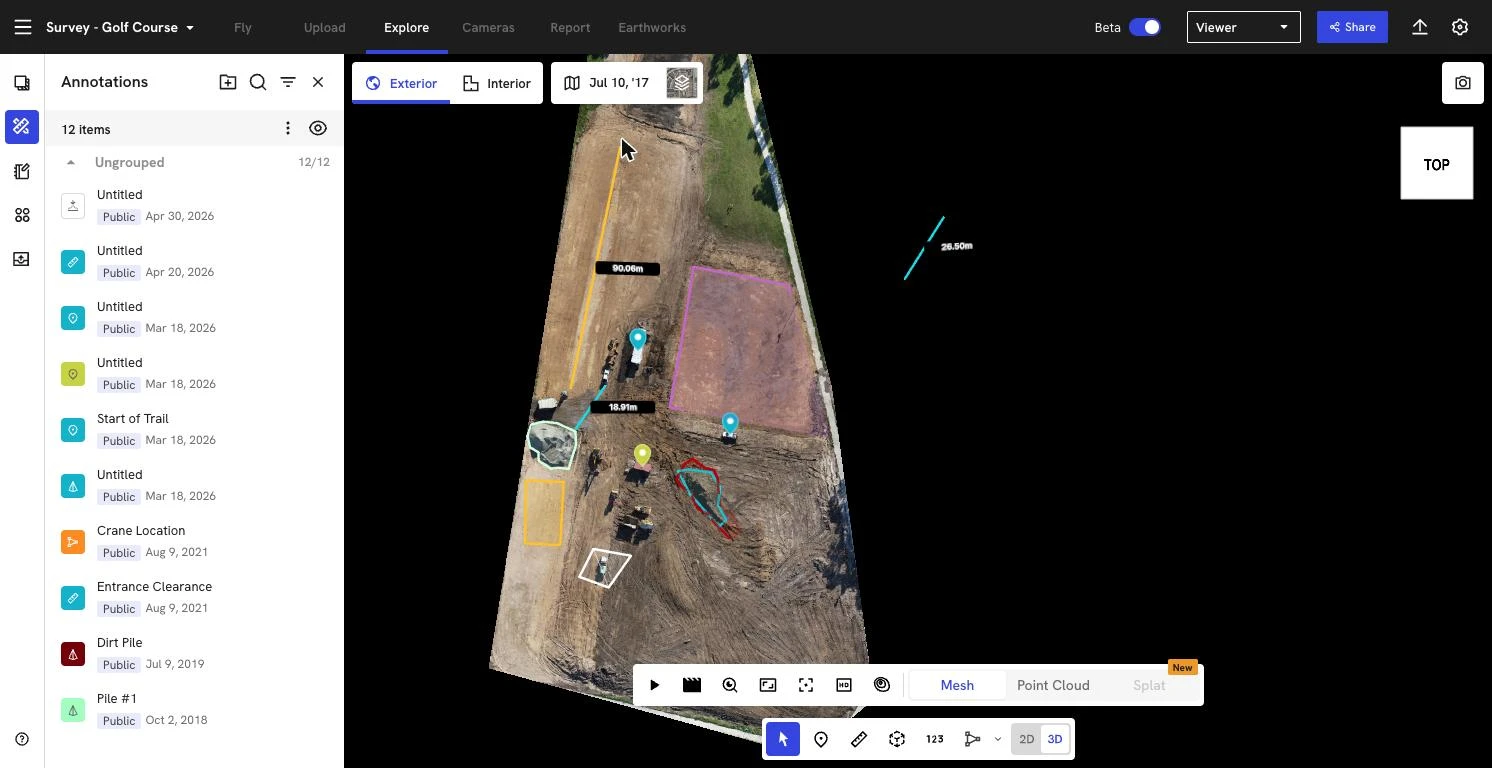
These maps also help when you plan a renovation or an expansion, because photogrammetry gives you a measured surface of the site as it stands today. See how DroneDeploy supports agriculture and turf teams.
The bottom line
You cannot walk every hole every day, but you can fly the course and send your crew to the right place first. Fly the same route, review it as a team, check it on the ground and keep the map. See how teams map turf with DroneDeploy. Book a demo.

FAQ

Ready to learn more?
Contact sales to see how DroneDeploy can give your teams the power to document and analyze your sites from the air and ground – all in one AI-powered platform.